Global Supply Indicator
The Global Supply indicator assesses whether forecasted production is sufficient to meet forecasted demand. The indicator takes into account changes on both sides of the global food equation:
- Production and storage from the supply side.
- Changes in population and income from the demand side.
Existing supply forecasts do not account for changes in demand due to population growth and income, and they do not provide an easily understandable assessment on the severity of potential shortages. The Global Supply Indicator translates these factors in order to demonstrate the severity of risk.
A more detailed description of how this indicator is calculated and assessed can be found here.
How to interpret this indicator?
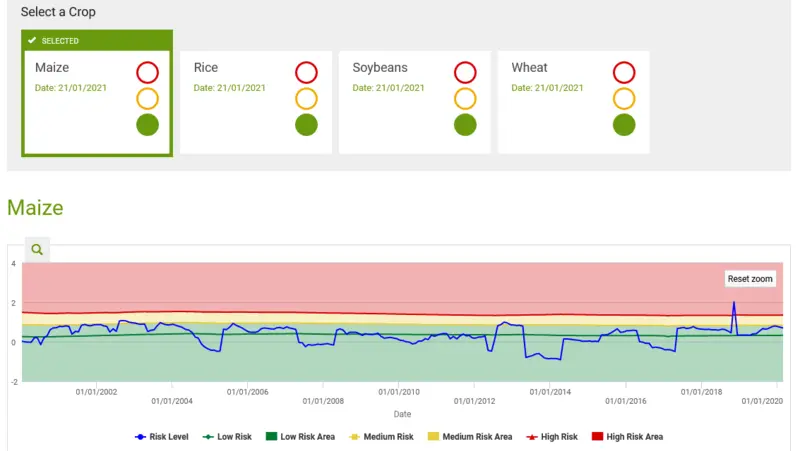
GREEN ALERT (LOW RISK): Green shaded area refers to low or minimal risk to food security.
AMBER ALERT (MEDIUM RISK): Above the yellow line and into the yellow shaded area shows that the demand is exceeding the forecasted supply at a concerning rate.
RED ALERT (HIGH RISK): Above the red line and into the red shaded area shows that the demand is exceeding the forecasted supply at an alarming rate. This may lead to high market prices and potentially serious food shortages in vulnerable regions.
The blue line shows the monthly risk with its moving average depicted by the green line.
Advantages of this indicator?
Risk is better understood by considering both the supply and demand side of the indicator.
What can this indicator capture?
Shortfalls in the global food supply to four keys crops worldwide.
Strong signals on likely food price developments.
Forecasted changes in population.
Forecasted changes in GDP.
A complementary tool to the other national level indicators. (In the future we plan to extend this indicator to provide country-specific supply shortage warnings by integrating trade and national supply and demand forecasts).


