Excessive Price Volatility Indicator
This Excessive Price Volatility indicator was developed by the International Food Policy Research Institute (IFPRI) and the data collated on this website is available via http://www.foodsecurityportal.org/.
The indicator provides information on price fluctuations at international exchange markets, which is important as evidence suggests that price increases and volatility transmits to local markets. The FAO recognizes that high food price volatility has a negative impact on food security. This volatility affects particularly the most vulnerable groups (smallholder/family agriculture and low income urban and rural populations). The impacts of price fluctuations at the international exchange market transmitting to domestic markets was exemplified during the 2007/08 food price crisis that affected several countries.
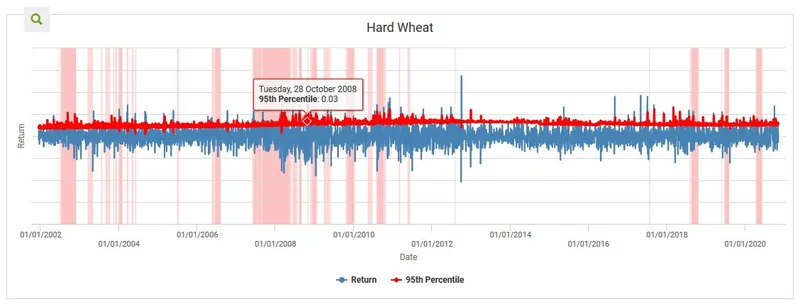
The indicator provides a daily volatility status as well as a visual representation of historical periods of excessive global price volatility from 2000-present.
A more detailed description of how this indicator is calculated and assessed can be found here.


How to interpret this indicator?
GREEN ALERT (LOW RISK): Based on the model, the number of observed days of high price returns are consistent with the expected number of high price returns (meaning there is period of low price volatility).
AMBER ALERT (MEDIUM RISK): Based on the model, the number of observed days of extreme price returns are not consistent with the expected number of extreme price returns (meaning there is a strong possibility that we are in a period of high price volatility).
RED ALERT (HIGH RISK): Based on the model, the number of observed days of extreme price returns are not consistent with the expected number of extreme price returns (meaning there is very high certainty that we are in a period of high price volatility).
Days in volatility reflects the number of continuous days in the current level of volatility. For example, 20 days of low volatility means that since the last instance of moderate or high volatility, there have been 20 days of low volatility.
For more technical information into the levels of risk, please visit HERE.
Advantages of this indicator?
Timely, accurate and transparent market information is important for addressing food price volatility and achieving the ultimate goal of food security (especially among the poor in developing countries).
It will help reduce inconsistent information on price variability on the global level by providing timely and transparent market information.
Better and more precise information will enable policies to be devised that can mitigate the impacts of volatility on both producers and consumers (especially among the poor in developing countries).
Further advantages can be considered by reading IFPRI’s full press statement here.
What can this indicator capture?
Price abnormalities for key commodities in the global agricultural markets.
Identify timespans of increased price variability on international markets.
Daily updates that forewarns policy-makers and humanitarian agencies about periods of time when excessive food price variability is happening.


