Global impacts from trade in agricultural commodities: Estimating carbon footprints of Brazilian soy exports
Global trade causes a displacement and distribution of impacts across increasingly interconnected supply chains. Environmental footprints, such as the ‘carbon footprint’ of coffee, are calculated to gauge impacts. These depend largely on the location of production, transport infrastructure and export logistics.
Researchers from ZEF, together with partners from Spain, Belgium and Sweden developed a framework to estimate spatially-explicit environmental footprints of agricultural products with unprecedented accuracy. They based their work on the integration of Life Cycle Assessment with data from the initiative “Transparent Supply Chains for Sustainable Economies” (Trase, see: https://trase.earth/). This new approach is used to quantify the greenhouse gas emissions from trade in Brazilian soy, the most traded agricultural commodity in the world.
Carbon footprints at sub-national scales
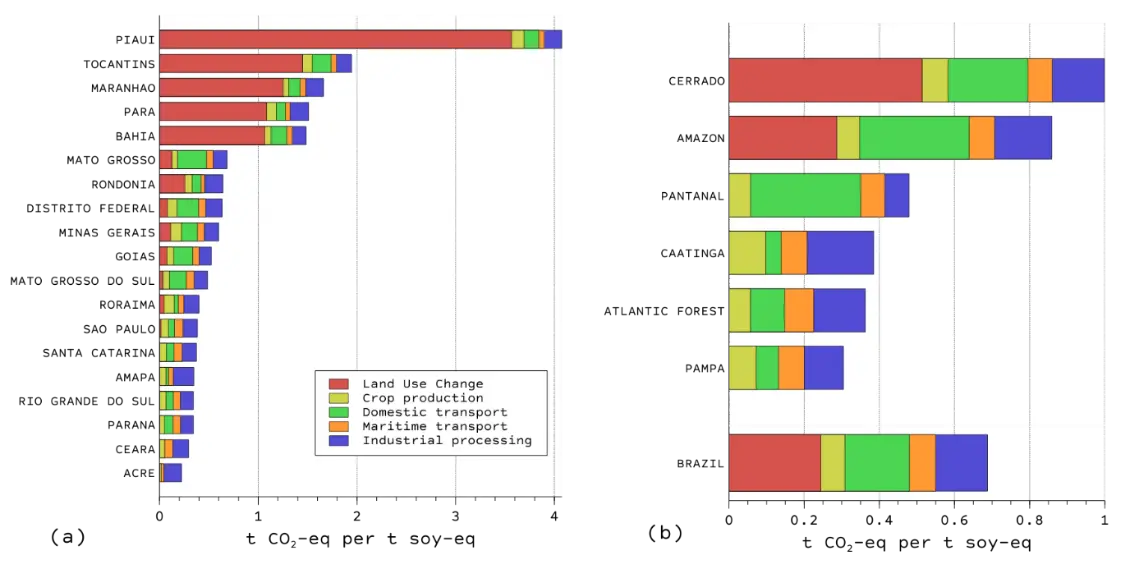
The study is the first to provide an estimate of the carbon footprint of Brazilian soy exports across the entire sector and for each of the nearly 90,000 trade flows of beans, oil and cake identified in the period 2010-2015. Results per unit of product show a large variability, not previously detected in previous studies. The most carbon-intensive products originate from municipalities where soy was grown at the cost of natural vegetation, mainly Cerrado savanna but also Amazon rainforest. Municipalities with the largest carbon footprint are located in the MATOPIBA region – consisting of the states of Maranhão, Tocantins, Piauí, and Bahia – the current hotspot of soy-induced deforestation. Together with Pará, these are the top five states with the largest state-level footprints. Transport throughout Brazil is also an important contributor to greenhouse gas emissions: it makes up more than a third of the emissions in the export-oriented states of Goiás and Mato Grosso in Center-West Brazil.
Implications for global responsibility
The results reveal a large variability in the footprint of importing countries and regions per unit of soy. Surprisingly, the European Union shows the largest footprint among all regions (0.77 tCO2-eq/t), even larger than China’s (0.66 tCO2-eq/t), the world’s largest single importer. This is because major EU countries import soy from the MATOPIBA region in large amounts, while China imports a larger share of soy from municipalities where land was cleared long ago. China still accounts for more than half of the total green house gas emissions in absolute terms, but the European Union imports more emissions from deforestation. This study can inform companies’ decisions on where to source soy to reduce their carbon footprint and prevent deforestation in Brazil, while enabling coordinated action for more effective governance at the local, regional, national, and international levels.
For further information, see:
Neus Escobar et al. Spatially-explicit footprints of agricul-tural commodities: Mapping carbon emissions embodied in Brazil’s soy exports. Global Environmental Change, Vol. 62 (2020). https://doi.org/10.1016/j.gloenvcha.2020.102067
More about the STRIVE project: http://strive-bioecon.de/